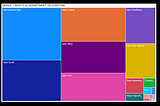
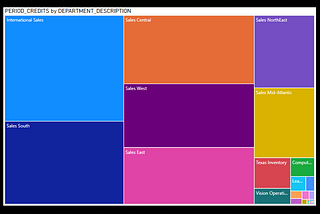
PinnedThe Data InsightsinILLUMINATIONVisuals in Power B I (Part 2)What is Data Visualization?3 min read·Feb 3, 2022----
PinnedThe Data InsightsinILLUMINATIONIntroduction to Business intelligenceWhy B I? Business intelligence helps to generate reports from your data and helps to monitor business growth in real time. There are a lot…2 min read·Jan 31, 2022--1--1
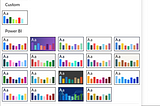
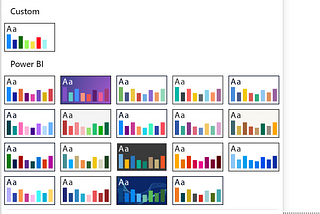
PinnedThe Data InsightsinTechnology HitsThemes & creating themesWhy themes are important?4 min read·Feb 24, 2022--1--1
PinnedThe Data InsightsPython in Power B I.Python in PBI is used to enhance the report. This blog will guide you to understand how to use the Python visual in PBI.3 min read·Mar 19, 2022--2--2